

Grounded theory analysis
Selection of expert sample
The selection of experts is a critical step in ensuring the scientific rigor and credibility of the study. The qualifications and research fields of the experts serve as the primary criteria for determining their eligibility. In this study, 10 experts from diverse fields, including Zen masters, designers, university professors, and furniture business owners, were selected. The rationale for this sample size is as follows: First, in qualitative research, the sample size is not fixed but is determined by the point of data saturation—when no new information or themes emerge from the data44. Previous studies suggest that a sample size of 10–30 participants is generally sufficient to achieve representativeness and data depth45. Second, the choice of 10 experts strikes a balance between ensuring data richness and avoiding unnecessary complexity or redundancy that might arise from a larger sample. Additionally, the diversity of the experts—spanning Zen culture, design practice, academic research, and industry experience—ensures a comprehensive and multidimensional perspective, thereby enhancing the credibility of the qualitative data. This rigorous selection process allows the study to thoroughly capture the complex relationship between Zen aesthetics and tea table design, providing a robust empirical foundation for the research findings.
Zen masters excel at integrating Zen principles into everyday life, pursuing inner tranquility and wisdom. Interviewing Zen masters provides firsthand insights into the essence and core values of Zen aesthetics, offering information that literature reviews and theoretical research may not fully capture. This helps establish design guidelines and elements closely aligned with Zen aesthetics, avoiding superficial interpretations of Zen concepts. The rationale for conducting in-depth interviews with experienced designers is their expertise in innovative thinking and aesthetic expression, enabling them to create unique and captivating designs. Through these interviews, valuable insights and creative ideas can be gained on how to incorporate Zen aesthetic elements into cultural product design, which is crucial for enhancing the research’s innovation and practicality. University professors, known for their rigorous academic research and knowledge dissemination, ensure the accuracy and depth of the study’s content. Furniture industry business owners, with their keen insight into market trends and consumer preferences, ensure the commercial viability and sustainability of the design activities. The background data of the experts are shown in Fig. 2.

Background data of experts.
Data collection
To ensure comprehensive and objective responses, in-depth interviews were conducted with participants from different categories. During the interviews, the interviewer should avoid leading questions and instead guide the interviewees to express their own perspectives. With the interviewees’ consent, the interviews were recorded to ensure that the collected information is accurate and complete.
Purpose of Zen master interviews: To identifying Zen aesthetic features in Chinese cultural and creative products. The interview content was prepared in two parts, focusing on this objective. By interviewing Zen masters, the research aims to thoroughly explore the influence of Zen philosophy on contemporary Chinese furniture design, facilitating a better understanding and application of these elements in subsequent studies. The interview questions are presented in Table 2.
Purpose of interviews with designers and university professors: The objective was to analyze the application of Zen aesthetics in the design of Chinese cultural products. Interviews with experienced designers aimed to thoroughly explore the practical implementation of Zen aesthetics in the design process. This analysis helps to better understand the value and significance of Zen aesthetics in the design field, providing inspiration and guidance for designers. The interview questions are listed in Table 3.
Purpose of interviews with business owners: The goal was to gain insights into market trends and consumer demands. As front-line observers of the market, business owners can provide direct information about consumer needs and market trends. Their unique perspectives on how to skillfully integrate Zen culture with furniture design are invaluable for creating Zen-inspired furniture that meets market demands while embodying deep cultural significance. The interview questions are listed in Table 4.
Open coding
Recorded interviews were transcribed and analyzed using ATLAS for Mac. To minimize subjectivity, open coding was employed to categorize raw data, identifying new insights from phenomena observed in the data. This process involved conceptualizing raw information, summarizing repeatedly to remove redundant and irrelevant data, ultimately resulting in 11 categories, as detailed in Table 5.
Axial coding
Axial coding involved organizing raw data into related categories and identifying major categories based on logical relationships. The process distilled data into three main categories: functionality, human–machine interaction, and safety, as shown in Table 6.
Selective coding
Selective coding extracted the most critical core categories by analyzing the relationships between major categories and integrating them into a coherent framework. This method provided a comprehensive summary of category interrelations, as detailed in Table 7.
Theoretical saturation testing
Theoretical saturation testing ensured the validity and reliability of the research model. By re-analyzing three reserved data sets until no new concepts or categories emerged, we confirmed the theoretical saturation of the model.
Hierarchical model construction
Using expert interviews and the analytic hierarchy process (AHP), we organized and categorized user requirements for product into three levels: target layer, criteria layer, and indicator layer. The target layer represents the overall user demand for Zen aesthetic style tea table (V). The criteria layer divides user requirements into Aesthetics (A1), Functionality (A2), Emotionality (A3), and Safety (A4). The indicator layer further breaks down these criteria into specific needs, as shown in Fig. 3. This hierarchical model sets the stage for subsequent matrix analysis.

Product design hierarchy model.
User demand analysis based on AHP
Calculating user requirement weights
After building the product design hierarchical model, the AHP hierarchical analysis method is used to construct the user demand judgment matrix. Complex problems under multi-objective conditions can be analyzed in a hierarchical manner, and then the decision evaluation consistency can be verified to further determine the weight of user needs, so as to reduce decision-making deviations. The calculation steps are as follows. The calculation steps are as follows:
Step 1 Construct the judgment matrix. First, invite the above 10 experts to compare the design indicators of Zen aesthetic table in pairs to construct the judgment matrix. Use the 1–9 scaling method in Table 8 to assign values.
Step 2 Calculate the user demand weight values using formulas (2)–(4), as shown in Tables 9, 10, 11, 12 and 13.
Step 3 Perform a one-time test using formulas (5)–(7). The test results are shown in Table 14. The CR index is less than 0.1, which meets the consistency test.
Design indicator ranking
After the consistency test of each factor is passed, the weight values of each item in the user demand criteria layer of Zen aesthetic style tea table are multiplied by the weight values of the corresponding indicator layer, and the comprehensive weight value of each demand indicator in the entire target demand system can be calculated. Sort the results by weight. As shown Table 15.
Based on the calculation results, the importance of criteria in Zen aesthetic tea table design, ranked from most to least significant, are as follows: Aesthetic criteria, Emotional criteria, Safety criteria, and Functional criteria. In the design process of the tea table in this study, the connection between Zen aesthetic principles and sustainable design is profoundly reflected through the four dimensions in the aforementioned hierarchical model.
In the design process of the tea table in this study, the connection between Zen aesthetic principles and sustainable design is profoundly reflected through the four dimensions of Aesthetic, Functionality, Emotionality, and Safety in the aforementioned hierarchical model.
Firstly, in the aesthetic (A) dimension, the design adopts a minimalist style (A1) and harmonious shape (A2), avoiding excessive decoration and pursuing simplicity in shape and visual balance, embodying the Zen principle of ‘less is more’. Simultaneously, the preservation of the material’s original texture (A3) and the application of plain colors (A4) showcase the beauty of nature, resonating with the Zen aesthetic’s reverence for simplicity and authenticity. This minimalist design not only reduces material waste but also directly reflects the core principles of sustainable design through the use of natural materials such as wood and stone. In this study, the tabletop is crafted from black walnut wood, a natural and environmentally material (D1). Its unique growth patterns and warm texture not only imbue the tea table with cultural connotation depth (C3) but also demonstrate the Zen aesthetic’s respect for natural resources and a lifestyle of simplicity through the material’s recyclability.
In the functionality (B) dimension, the design emphasizes ease of maintenance (B1) and durability (B2), ensuring that the tea table remains in excellent condition during daily use, thereby reducing maintenance costs and resource consumption. Practicality (B3) considerations ensure that the tea table is not only aesthetically pleasing but also meets users’ practical needs, such as providing ample storage space or adapting to various usage scenarios.
In the emotionality layer (C), it ranks second in the criteria layer in terms of concentrated weight. The design emphasizes the use of natural materials and nature-inspired forms to evoke user reflection (C1) and foster a connection with nature (C2), conveying Zen aesthetics’ philosophy of respect for and harmonious coexistence with nature. The integration of cultural connotation (C3) not only adds spiritual depth to the design but also, through the key element of “establishing a connection with nature” (C2), fulfills modern consumers’ desire to return to nature, imbuing the product with deeper emotional value. This design not only strengthens the spiritual essence of Zen aesthetics but also enhances the user experience through emotionality, transforming the tea table into a bridge connecting nature, culture, and the human spirit.
Finally, in the safety (D) dimension, the design ensures user safety by selecting environmentally materials (D1) and ensuring a sturdy structure (D2). The durability (B2) and practicality (B3) of the design extend the product’s lifecycle, reducing resource waste. In this study, the supporting structure of the tea table is made of unpolished natural stone, connected to the tabletop using mortise and tenon joints. The robust and durable nature of the stone further enhances the safety of the tea table, while the rough texture of the stone contrasts with the smooth tabletop, enhancing the aesthetic appeal. The use of sturdy natural materials extends the product’s lifespan, reducing the need for frequent replacements and resource waste, thereby reinforcing the product’s sustainability.
These principles seamlessly integrate the spiritual essence of Zen aesthetics with sustainable principles, creating a tea table that combines functionality and cultural depth, offering users a dual experience of visual and spiritual enjoyment. This embodies the unity of sustainable design and Zen aesthetics. These design principles will provide important guidance for subsequent product design.
Design practice
Design concept
According to the ranking results of the above-mentioned Zen aesthetic tea table design standards, we selected the first six indicators with greater weights to conceive the scheme, as shown in Table 16.
Design solution expression
According to the design indicators, the design scheme is sketched.
Design scheme 1
This design features a tabletop made from decayed wood, imbuing the product with a sense of time and history. The natural shape of the decayed wood itself contributes to this ritualistic aesthetic. Two symmetrical stone slabs are horizontally placed on the ground to support the tabletop, enhancing the design’s visual and tactile richness. As illustrated in Fig. 4.

Design scheme 2
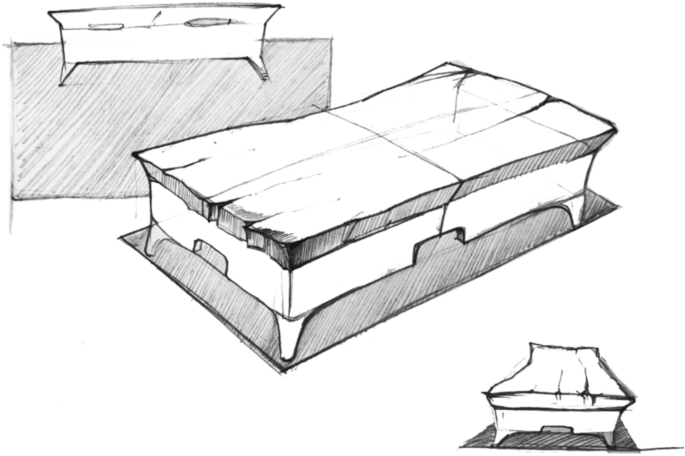
This scheme combines wood and stone to create a simple and refined design. The tabletop is made from a branched tree trunk, while naturally shaped stones are used as supports. This choice of materials emphasizes not only the pursuit of natural beauty but also the durability and stability inherent in stone. The use of stone and wood symbolizes the Zen aesthetic of nature, where stone represents mountains and wood represents forests, embodying a harmonious coexistence. As illustrated in Fig. 5.

Design scheme 3
This design features a marble base paired with an unprocessed weathered wooden tabletop, creating a textural contrast that highlights the simplicity and natural beauty. As illustrated in Fig. 6.
Fuzzy comprehensive evaluation
The fuzzy comprehensive evaluation method is a comprehensive evaluation approach based on fuzzy mathematics (1) This method is characterized by clear results and strong systematicity, effectively addressing the problem of unquantifiable subjective factors introduced by designers, thereby helping designers select the optimal solution (2) The specific steps are as follows:
Step 1 Invite 10 experts to participate in the evaluation of the criteria indicators. The criteria are denoted as U = {u1, u2, u3, u4}, representing the aesthetics criterion, functionality criterion, emotionality criterion, and safety criterion.
Step 2 Establish evaluation levels and scoring standards. Define the evaluation set V = {V1, V2, V3, V4} = {Very Satisfied, Satisfied, Average, Dissatisfied} with corresponding scores of 90, 80, 70, and 60, respectively.
Step 3 Construct the fuzzy comprehensive evaluation matrix. Invite evaluators to use the design evaluation model to assess the three preliminary schemes. The evaluators’ scores for each sub-criterion at each evaluation level are tallied to obtain the membership degree of each evaluation indicator relative to each evaluation level, thereby constructing the fuzzy comprehensive evaluation matrix R for each design scheme.
Taking Scheme 2, which received the highest score, as an example, RA represents the evaluation matrix for the aesthetics criterion in Scheme 2; RA represents the evaluation matrix for the functionality criterion in Scheme 2; RA represents the evaluation matrix for the emotionality criterion in Scheme 2; RA represents the evaluation matrix for the safety criterion in Scheme 2. The evaluation matrix is as follows:
$$R_{A} = \left[ {\begin{array}{*{20}l} {0.4} \hfill & {\quad 0.3} \hfill & {\quad 0.3} \hfill & {\quad 0.0} \hfill \\ {0.3} \hfill & {\quad 0.4} \hfill & {\quad 0.2} \hfill & {\quad 0.1} \hfill \\ {0.5} \hfill & {\quad 0.3} \hfill & {\quad 0.2} \hfill & {\quad 0.0} \hfill \\ {0.4} \hfill & {\quad 0.4} \hfill & {\quad 0.2} \hfill & {\quad 0.0} \hfill \\ \end{array} } \right]$$
$$R_{B} = \left[ {\begin{array}{*{20}l} {0.2} \hfill & {\quad 0.4} \hfill & {\quad 0.3} \hfill & {\quad 0.1} \hfill \\ {0.4} \hfill & {\quad 0.3} \hfill & {\quad 0.2} \hfill & {\quad 0.0} \hfill \\ {0.4} \hfill & {\quad 0.4} \hfill & {\quad 0.2} \hfill & {\quad 0.0} \hfill \\ \end{array} } \right]$$
$$R_{C} = \left[ {\begin{array}{*{20}l} {0.6} \hfill & {\quad 0.4} \hfill & {\quad 0.0} \hfill & {\quad 0.0} \hfill \\ {0.5} \hfill & {\quad 0.5} \hfill & {\quad 0.0} \hfill & {\quad 0.0} \hfill \\ {0.5} \hfill & {\quad 0.3} \hfill & {\quad 0.1} \hfill & {\quad 0.0} \hfill \\ \end{array} } \right]$$
$$R_{D} = \left[ {\begin{array}{*{20}l} {0.3} \hfill & {\quad 0.4} \hfill & {\quad 0.3} \hfill & {\quad 0.0} \hfill \\ {0.3} \hfill & {\quad 0.2} \hfill & {\quad 0.4} \hfill & {\quad 0.1} \hfill \\ \end{array} } \right]$$
Step 4 Perform a synthetic operation on the weight of each evaluation indicator and the corresponding evaluation matrix R to calculate the evaluation weight vector P of each indicator at the product solution standard layer. From Tables 8, 9, 10, 11 and 12, we can see that the weight vector of each indicator is:
$$\begin{aligned} &\upomega _{{\text{A}}} = \left( {0.4988} \quad {0.2347} \quad {0.1658} \quad {0.1006} \right) \\ &\upomega _{{\text{B}}} = \left( {0.0918} \quad {0.6381} \quad {0.2701} \right) \\ &\upomega _{{\text{C}}} = \left( {0.1668} \quad {0.3759} \quad {0.4574} \right) \\ &\upomega _{{\text{D}}} = \left( {0.3448} \quad {0.6552} \right) \\ \end{aligned}$$
According to the weight calculation, the evaluation weight vector P of each indicator in the scheme criteria layer can be obtained as follows:
$$\begin{aligned} & P_{A} = \omega_{A} \circ R_{A} = \left( {0.3930} \quad {0.3340 } \quad {0.2500} \quad {0.0230} \right) \\ & {\text{P}}_{{\text{B}}} =\upomega _{{\text{B}}} \circ {\text{R}}_{{\text{B}}} = \left( {0.4450} \quad { 0.3360} \quad {0.2090} \quad {0.0090} \right) \\ & {\text{P}}_{{\text{C}}} =\upomega _{{\text{C}}} \circ {\text{R}}_{{\text{C}}} = \left( {0.5620} \quad {0.3920 } \quad {0.0460} \quad {0.0000} \right) \\ & {\text{P}}_{{\text{D}}} =\upomega _{{\text{D}}} \circ {\text{R}}_{{\text{D}}} = \left( {0.3000} \quad {0.2690} \quad {0.3660} \quad {0.0660} \right) \\ \end{aligned}$$
On this basis, the fuzzy comprehensive evaluation matrix of the overall indicators can be constructed:
$$P_{V} = \left[ {\begin{array}{*{20}c} {P_{A} } \\ {P_{B} } \\ {P_{C} } \\ {P_{D} } \\ \end{array} } \right] = \left[ {\begin{array}{*{20}l} {0.3930} \hfill & {\quad 0.3340} \hfill & {\quad 0.2500} \hfill & {\quad 0.0230} \hfill \\ {0.4450} \hfill & {\quad 0.3360} \hfill & {\quad 0.2090} \hfill & {\quad 0.0090} \hfill \\ {0.5620} \hfill & {\quad 0.3920} \hfill & {\quad 0.0460} \hfill & {\quad 0.0000} \hfill \\ {0.3000} \hfill & {\quad 0.2690} \hfill & {\quad 0.3660} \hfill & {\quad 0.0660} \hfill \\ \end{array} } \right]$$
Then the comprehensive evaluation vector of the table design is:
$${\text{S}} =\upomega _{{\text{V}}} \circ {\text{P}}_{{\text{V}}} = \left( {0.4330} \quad {0.3410 } \quad {0.2040} \quad {0.0220} \right)$$
Finally, through the weighted calculation of the comprehensive evaluation vector S and the corresponding scores of the comment set levels, Scheme 2 achieves a total percentage evaluation score of 81.85, while Scheme 1 and Scheme 3 receive scores of 73.93 and 75.34. The detailed calculation process for Scheme 1 and Scheme 3 is provided in Appendix S1. Based on the FCE analysis results, Scheme 2, which obtained the highest score, is ultimately selected for further in-depth design and processing.
link